Estimates from the U.S. Census Bureau’s annual American Community Survey provide insights into the economic conditions of New Hampshire residents. Estimates released in December 2018 average responses over the five-year period from 2013 to 2017, which allows for more certainty among population groups than annual data alone.
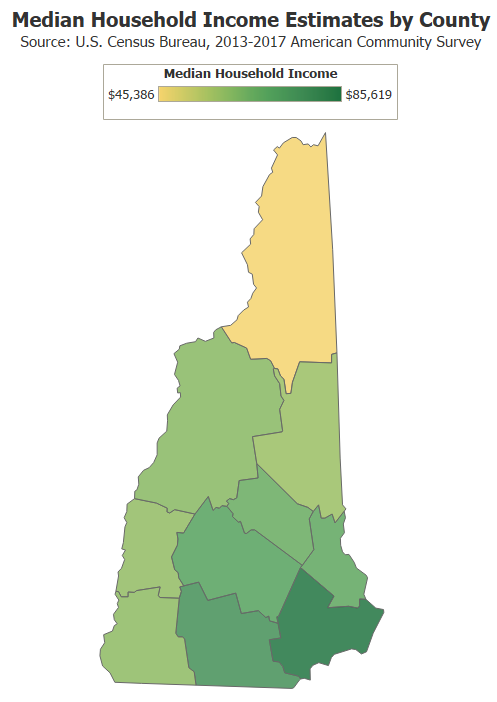
Median Household Income by County
Median household income varies considerably within New Hampshire, and is in part driven by distance from the Boston metropolitan area. Rockingham County’s estimated annual median household income for the 2013 to 2017 period was approximately $85,600 in inflation-adjusted 2017 dollars, which was about $9,800 per year greater than the next highest income county, Hillsborough County. Coos County had the lowest estimated median household income during this period at approximately $45,400, which was about $12,800 less than that of Carroll County, the next lowest county estimate, and $40,200 less than Rockingham County’s estimate.
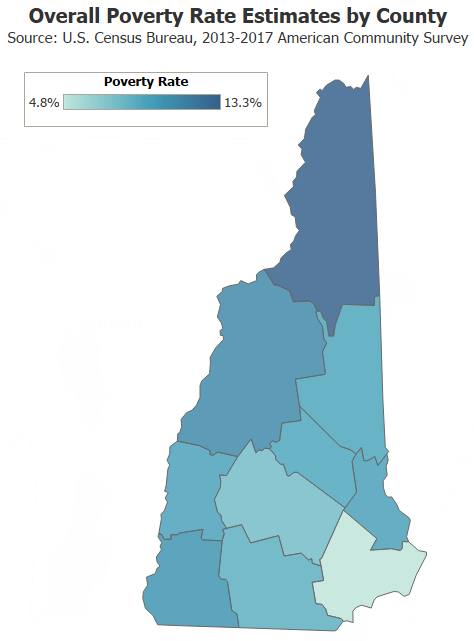
Poverty Rates by County
Following the inverse pattern of median household income, concentrations of poverty generally increased as distance from the more urban, southeastern portions of the state increased. In 2017, an individual less than 65 years old and earning less than $12,752 was in poverty, as was a family of three with one child earning less than $19,730. Rockingham County had the lowest county poverty in the state at 4.8 percent. While all other county estimates were statistically indistinguishable from at least one other county estimate, the highest estimated poverty rate was 13.3 percent in Coos County.1 Estimates of poverty for those under 18 years of age were spread more widely, with about one in five children in Coos County estimated to be living in poverty, compared to one in seventeen children in Rockingham County, the only county significantly different than all others. Estimates of poverty for those aged 65 and up ranged from about one in twenty-four in Sullivan County to one in twelve in Coos County, although all county estimates were statistically indistinguishable from at least one other county.
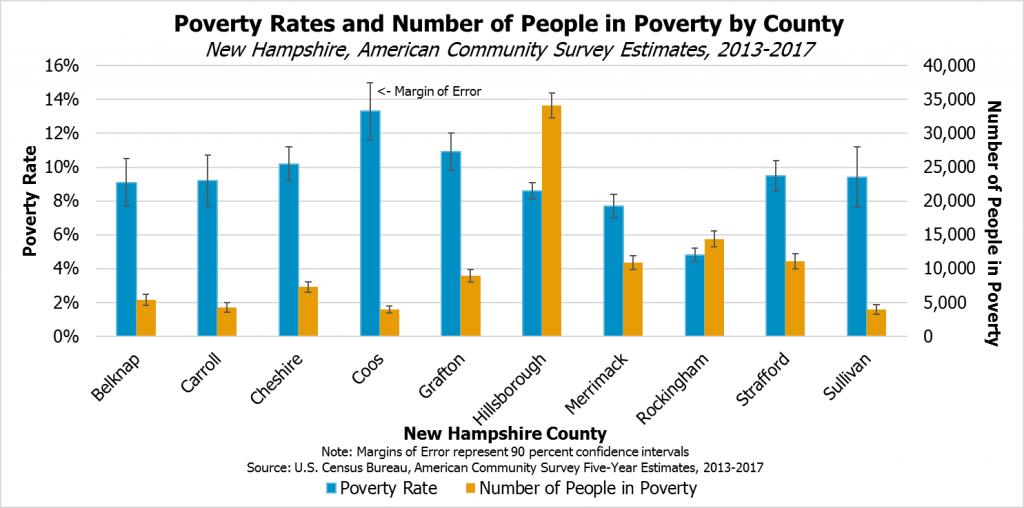
Differing county poverty rates, however, do not necessarily reflect the number of people in poverty in these areas. While Rockingham County has the lowest poverty rates in New Hampshire, this county is estimated to be home to the second largest number of people in poverty, about 14,400, relative to other counties in the state. Hillsborough County was home to an estimated 34,100 people living on poverty-level incomes, the highest county-level estimate in the state.
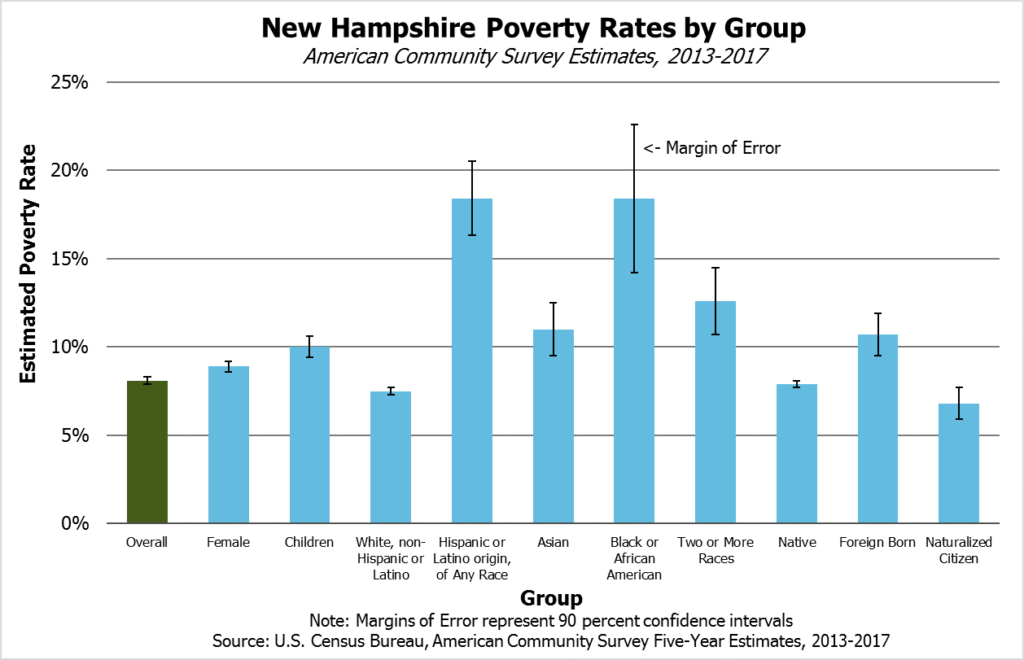
Statewide Demographic and Family Groups
Certain groups are more likely to face economic hardships than other populations. Among racial or ethnic groups, non-Hispanic whites were the least likely to be in poverty from 2013 to 2017 in New Hampshire, while other groups faced higher poverty rates. Between one out of every seven and two out of every nine black or African-American Granite Staters were in poverty, with a similar estimated proportion of Hispanic or Latino residents in poverty. Individuals who were female, under age 18, or foreign born also faced higher poverty rates than the population as a whole.
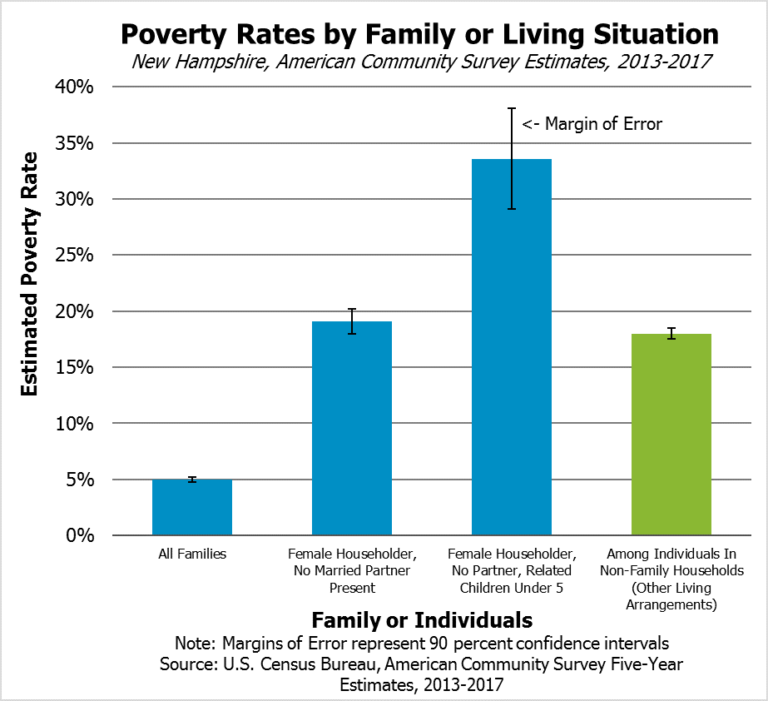
Different family compositions faced different poverty rates as well. Families with female householders with no married partner present were more likely to be in poverty than families overall, with roughly one out of three of these families with a child under five years old in poverty. Individuals in non-family households also faced relatively higher poverty rates. The number of grandparents of any income responsible for grandchildren under age 18 also increased between the 2008 to 2012 and the 2013 to 2017 period, with an about 7,700 grandfamilies in the more recent estimates.
Sources
[1] Statistical testing completed at the 95 percent confidence level for text comparisons. The Census Bureau reports 90 percent confidence intervals, presented graphically.