For people who are chronically ill or have a disability and who are seeking an alternative to nursing home care, New Hampshire’s Medicaid program provides long-term care coverage for eligible adults of limited means in home- and community-based settings. Choices for Independence Medicaid Waiver services are delivered through providers who are reimbursed by federal, county, and state government funds for delivering home- and community-based care. These services are also typically less expensive than nursing home care, and help individuals remain in their homes and communities.
Choices for Independence Medicaid Waiver services are often delivered in the homes of those in need, but provider agencies struggle to supply services when they have too few workers to deliver them. Agencies primarily serving individuals covered by Medicaid rely on Medicaid reimbursements for revenue to pay their workers. Evidence suggests that reimbursement rates have fallen behind the rate of inflation. Wages may not have grown as quickly for direct care workers at the low-end of the pay scale as for workers in other New Hampshire industries or for workers in the same industry in neighboring states. Key agencies involved in the management of service provision report that workforce shortages limit or prevent service delivery. State demographic projections suggest that there may be an even greater need for such home- and community-based services in future decades.
This Issue Brief explores available data concerning labor force constraints in New Hampshire generally, as well as relevant demographic trends and wages for certain health care occupations related to home- and community-based services. It also presents survey data relative to the Choices for Independence Medicaid Waiver from key agencies, provides insight to state data on authorizations and payments for these services, and calculates trends in inflation-adjusted costs relative to reimbursement rates.
Medicaid Reimburses Providers for Services
The Medicaid program is a partnership between the federal and state governments to provide health coverage for specific populations with incomes below certain levels. In New Hampshire, Medicaid covers approximately 180,000 children, parents, pregnant women, people with disabilities, older residents and nursing home residents, and other individuals with low incomes. Portions of the Medicaid-eligible population receive certain services permitted through Medicaid waivers granted to New Hampshire by the federal government.[i]
Medicaid reimburses providers for delivering services, such as case management, specific medical services, and health-supporting home visits. The State of New Hampshire sets the reimbursement rates that define the amount of revenue an agency can collect for each service delivered under Medicaid, which is paid in part with federal grant dollars. Medicaid reimbursement rates for services are typically lower than reimbursement rates from Medicare or private-sector insurance companies, and may provide coverage for different types of services.[ii]
Choices for Independence Waiver Services Provide Home-Based Care
New Hampshire’s Choices for Independence (CFI) Medicaid Waiver provides certain home- and community-based long-term care services to eligible adults. The CFI Medicaid Waiver is designed to be an alternative to nursing home care, with the goal of helping to support residents who stay in their own homes and communities. Eligible residents must be age 18 or older, have a chronic illness or disability, be clinically in need of care at the level provided in a nursing home, and be financially eligible for Medicaid.[iii]
As part of the state-federal partnership in paying for Medicaid, the federal government pays for 50 percent of the costs for CFI Medicaid Waiver services. Under New Hampshire law, counties are responsible for most of the remaining cost for those receiving care at a nursing home, and pay most of the state-portion of CFI Medicaid Waiver services as well.[iv] Home health aide and adult day services are typically less expensive than the cost of a nursing facility, according to a national report from the AARP Public Policy Institute. The report also identified that New Hampshire had the second-lowest percentage of Medicaid long-term supports and services spending for older people and adults with physical disabilities dedicated to home- and community-based services of any state in 2016.[v]
Economic Context: A Limited Workforce Statewide
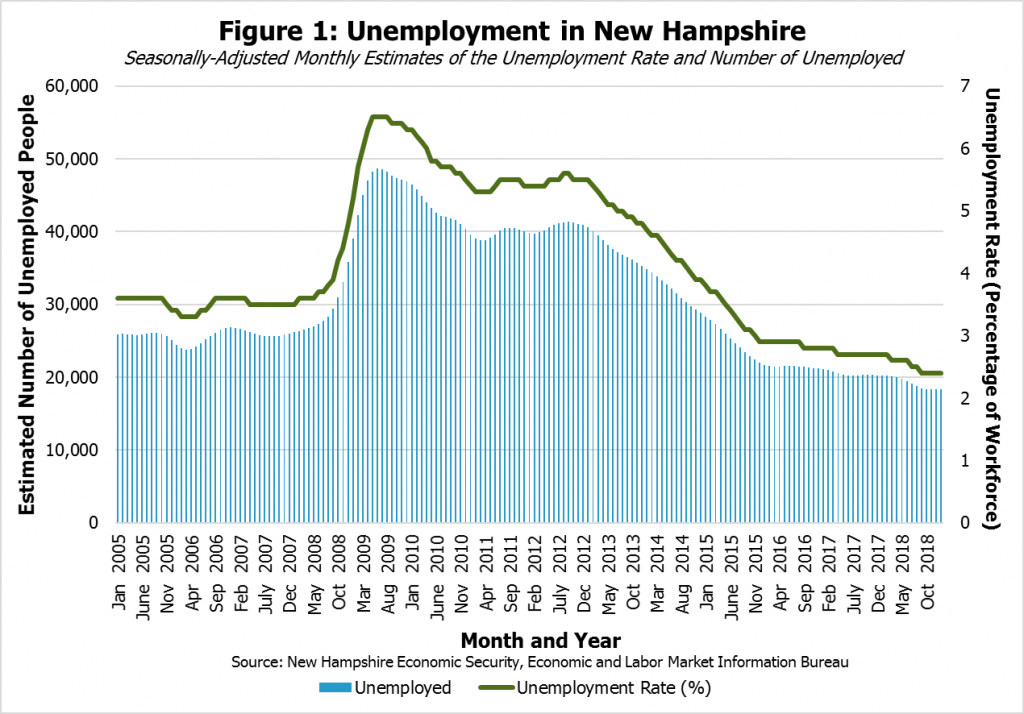
Despite New Hampshire’s strong economy, one of the key constraints that limits overall economic growth is a shortage of people in the workforce.[vi] New Hampshire’s unemployment rate has been estimated to be below 3 percent since December 2015; January 2019’s estimated rate of unemployment was 2.4 percent and reflected an increasingly small number of unemployed workers (see Figure 1). Although these estimated unemployment rates are the results of surveys and include some uncertainty, New Hampshire’s seasonally-adjusted unemployment rate was tied with Iowa as the lowest state-level unemployment rate in the country in preliminary estimates for January 2019.[vii] New Hampshire and Vermont typically have the lowest unemployment rates among the six New England states.[viii]
Unemployment rates are historically low nationally, with seven states recording their lowest estimated unemployment rates on record in December 2018.[ix] However, while wage growth has accelerated since the end of the Great Recession of 2007 to 2009, it remains slower than some economists have expected, given the tight labor market. A smaller supply of workers suggests that wages might increase faster as organizations compete for workers.[x]
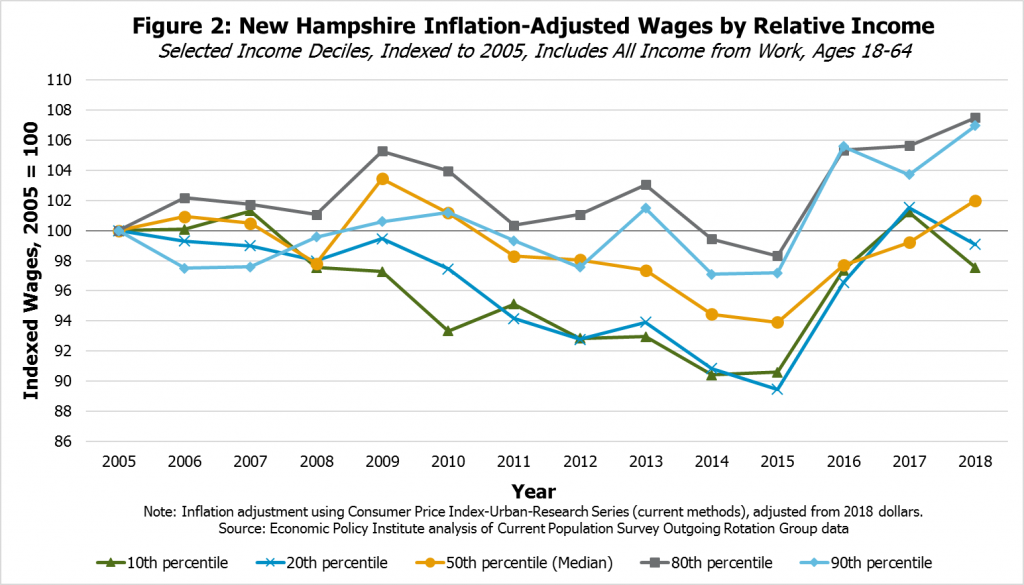
Evidence from national-level research suggests that low- and middle-wage workers and African-American workers benefit disproportionally from periods of very low unemployment, with higher wage growth and, in some instances, proportionally greater increases in hours worked than higher wage workers or white workers.[xi] Survey data from New Hampshire residents suggest that wage growth since 2015 for workers at the 10th and 20th percentiles of the spectrum has been faster than growth of median income from work; in other words, only 10 percent or 20 percent of incomes from work are lower than these wages, respectively, but income for workers at these wage levels grew substantially between 2015 and 2017 (see Figure 2). These workers had estimated wages in 2017 and 2018 that were near to the inflation-adjusted levels from 2005, finally recovering after a long period of providing less real purchasing power for low-income families following the Great Recession.
Wage Growth for Some Low-Wage Home Health and Personal Care Aides Has Fallen Behind Overall Growth
While wages for some workers at the lower-end of the income spectrum appear to have benefitted from a tight labor market in recent years, certain health care provider occupations, including those key for providing long-term supports and services under Medicaid, have faced relatively limited wage growth for workers with lower wages. Wages for home health aides and personal care aides provide some insight into trends in wages for this sector, and the sector may become increasingly important as New Hampshire’s population ages.[xii] Although there is statistical uncertainty around these survey-based data, comparing wage growth for home health and personal care aides with overall wage growth suggests workers at the low-end of the wage spectrum, represented by the 10th and 25th percentiles in this analysis, have actually seen more limited gains than the median wage earners in these occupations or low-wage workers in the labor force overall.[xiii]
In comparison to data from 2017, median wages for home health aides and personal care aides in New Hampshire have grown faster since 2015 than median wages for all occupations, without any inflation adjustments. Growth in median wages since 2013 has also been higher for home health aides and personal care aides than wages overall. Despite this faster rate of growth, the median hourly wage for all occupations in New Hampshire was still notably higher ($18.70) than for home health aides ($13.38) and personal care aides ($12.07) in 2017. Even with faster wage growth, home health aides and personal care aides remain relatively low-wage occupations.
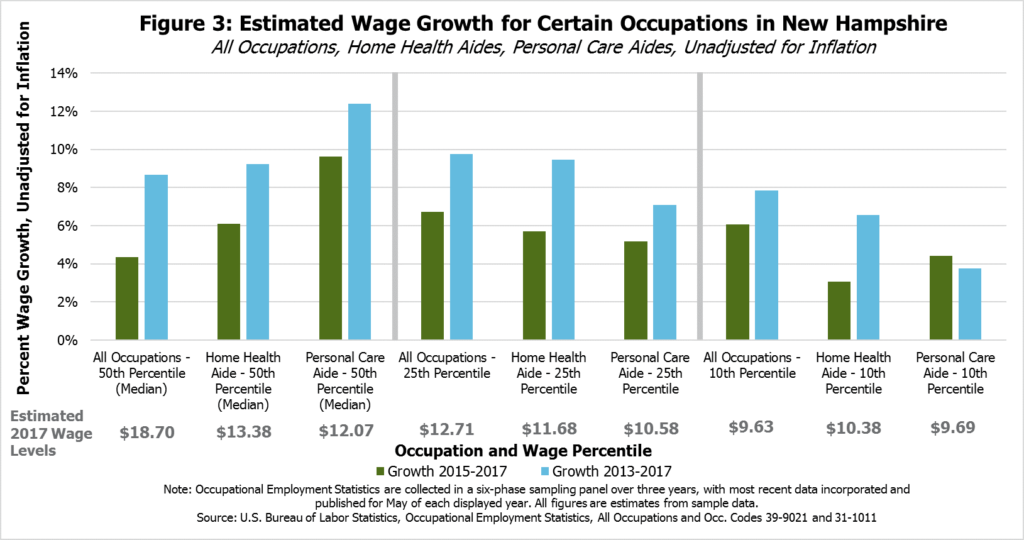
This faster rate of growth in the median wage is also not reflected in growth at the low-end of the wage spectrum for home health aides and personal care aides (see Figure 3). Although wage growth has been faster than the median wage for the 10th and 25th wage percentiles for all workers, comparing 2017 to both 2015 and 2013, the opposite appears to be true for home health aides and personal care aides. Estimated wage growth at the 10th percentile for home health aides and personal care aides, meaning only one out of every ten wages offered in this occupation were lower, appeared to fall below growth for all occupations between 2015 and 2017; wage growth from 2013 to 2017 followed a similar trend. At the 25th percentile, home health aide wage growth was almost as fast as growth for all occupations between 2013 and 2017, but home health aides and personal care aides otherwise slipped at least somewhat behind estimated growth for all occupations in the 25th percentile. The estimated hourly wage levels for 2017 show a smaller range across percentiles for the two specific occupations than for all occupations, reflecting the different range of job types included in all occupations that are not measured when examining a single occupation.
While the reasons for limited wage growth are likely complex, workers with lower wages in these two occupations may be more likely to have their pay affected by Medicaid reimbursement rates.
Medicaid reimbursement rates are generally lower than payment rates to providers from private insurance or Medicare.[xiv] Although these lower rates do not necessarily define the direct care provider wages, they do impact the revenue available to pay employees. Home health and personal care aides with lower wages may be disproportionately reliant on Medicaid reimbursement rates than median or higher wage earners in these professions, as higher private-sector health insurance reimbursement rates may help boost wages for workers who do not perform solely or primarily Medicaid-reimbursed services.
Private-sector entities that are less reliant or not reliant on Medicaid reimbursements for revenue, including those within and outside of the health care industries, may have more flexibility to increase wages. Those sectors receiving more revenue as a result of a growing economy, including food and accommodation services or other sectors with entry-level positions, may be able to offer higher starting wages than organizations more dependent on Medicaid for their revenue, which increases competition for a limited supply of workers. Agencies that provide solely or primarily Medicaid services may not be able to increase wages substantially without increases to reimbursement rates, which would require the approval of State policymakers. Provider organizations relying on Medicaid reimbursements to pay their employees may not be able to offer those employees wages higher than are available to them in other professions, including professions that may involve less complex or labor-intensive work.
Wage Growth for Low-Wage Home Health and Personal Care Aides Behind Growth in Neighboring States
Agencies employing home health aides and personal care aides and relying primarily on Medicaid reimbursements for payment may also face competition for workers within the same occupation, but across state lines.
Estimated median hourly wages for home health care aides in 2017 were estimated to be higher in Massachusetts ($14.30) than in New Hampshire ($13.38), and similar in Vermont ($13.49). Maine’s economy offered home health aides ($11.98) and personal care aides ($11.37) lower median wages than New Hampshire did for home health aides or personal care aides ($12.07). Massachusetts offered higher median hourly wages for personal care aides ($13.75), while data from Vermont were based on too small of a sample size to offer a reliable comparison. All these wage data include some statistical uncertainty, as they are based on surveys of employers.
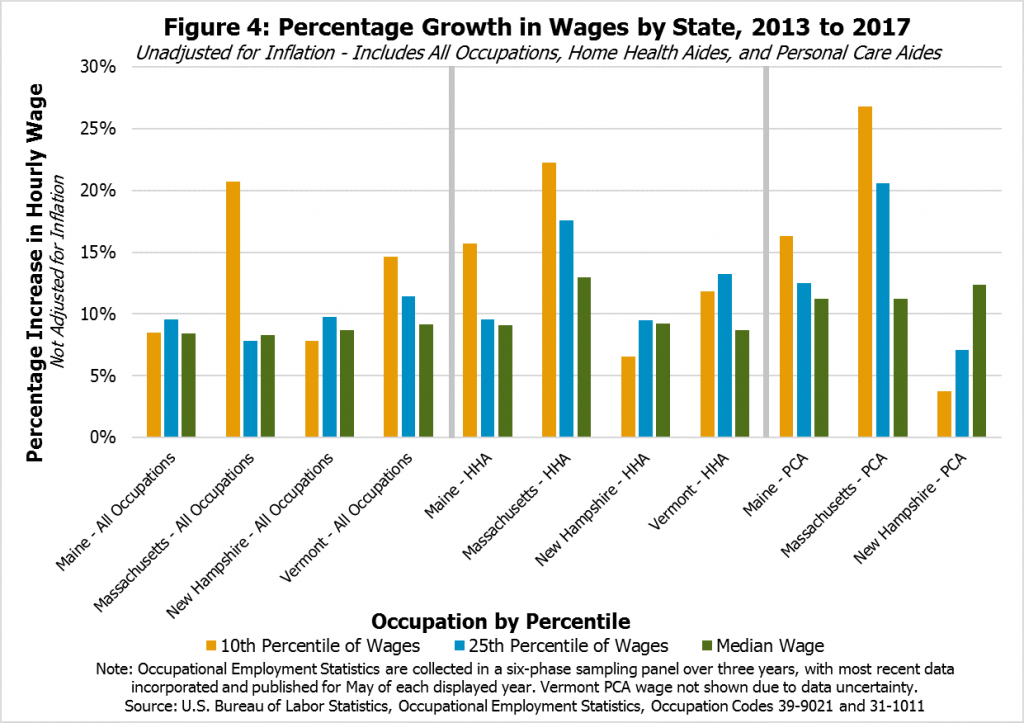
Data collected in recent years suggests New Hampshire’s home health and personal care aides at the lower end of the wage spectrum have seen less wage growth than their counterparts employed in neighboring states (see Figure 4). While wages for those workers in the 10th percentile of the pay scale in Massachusetts saw their incomes grow more than 20 percent between 2013 and 2017, Vermont’s home health aides have seen approximately 12 percent growth, and Maine’s home health and personal care aides have seen wages grow approximately 16 percent. However, New Hampshire’s home health and personal care aides have seen their lower-end wages lag these growth rates. With the exception of Maine’s home health aides and all occupations in Massachusetts, the data appear to suggest similar relative growth rates at the 25th percentile of wage earners.
Estimates at the 10th percentile of income across the four states show that, even though Maine’s 2017 levels appear to be similar to or lower than New Hampshire’s 2017 wage levels for home health and personal care aides, Maine’s wages for these two professions appear to have grown faster in recent years, as have those in Massachusetts and Vermont (Figure 5).
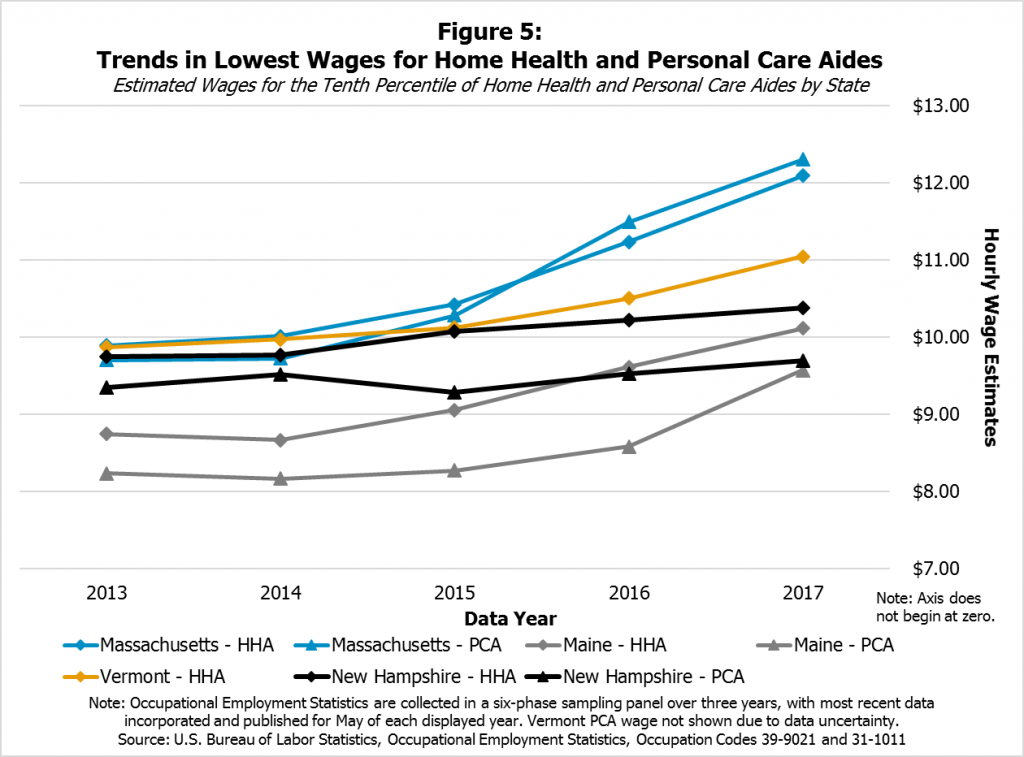
A variety of factors may be affecting the differences in wage growth for these low-income personal care aides and home health aides across these four states, and these data include statistical uncertainty. However, public policies are likely affecting these growth rates. Those earning low wages in these occupations may be disproportionately affected by policymaker decisions around reimbursement rates. They may also be affected by state policy decisions regarding state-level minimum wages. All New Hampshire’s neighboring states increased their required minimum wages at least once between 2013 and 2017, while New Hampshire’s minimum wage has remained at $7.25 an hour since 2009.[xv]
Aging Population May Increase Need for Medicaid Services
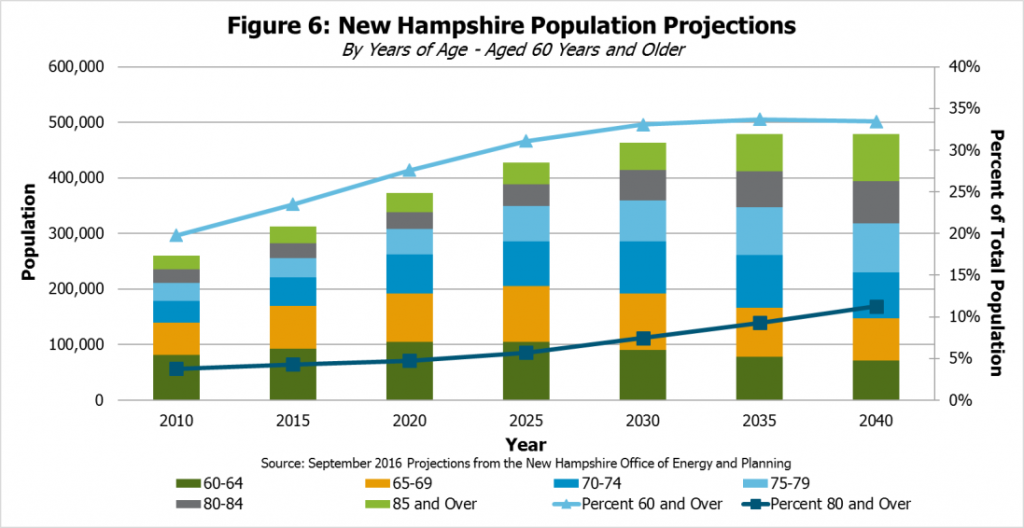
New Hampshire faces changing population demographics that may increase the need for Medicaid services to older residents. Demographic projections published by the State of New Hampshire Office of Energy and Planning in September 2016 estimate that about one in every three New Hampshire residents will be aged 60 or over in 2030 (see Figure 6).[xvi] If no fundamental shift occurs that dramatically changes the trends underlying these projections, there will likely be increased demand for nursing home services and other forms of assistance to older residents, including those delivered by home health and personal care aides and through Medicaid.
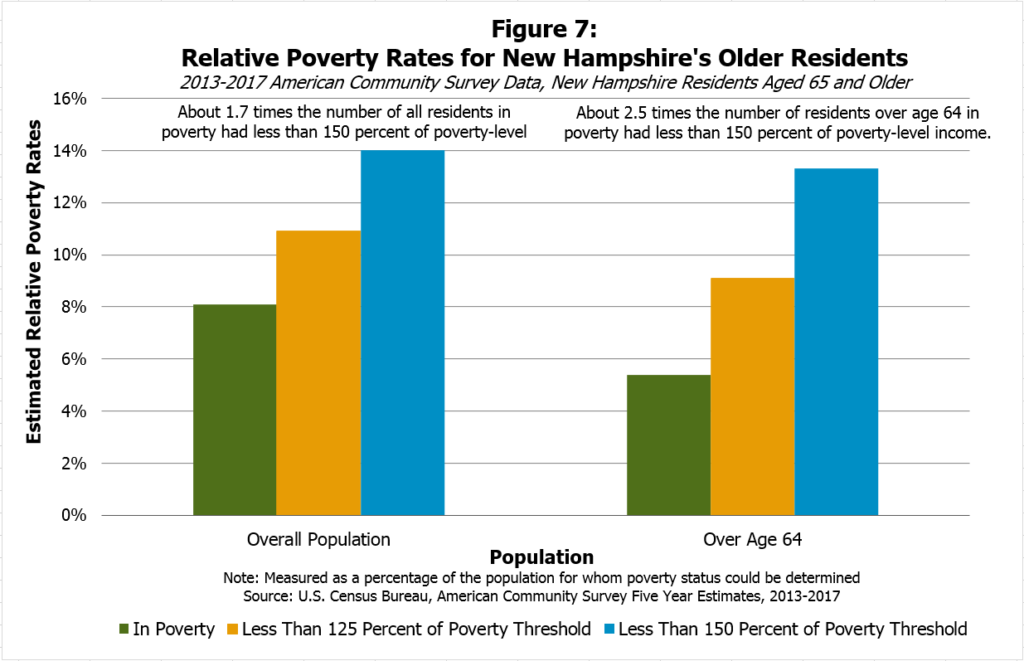
Older residents may also have limited incomes and assets, which suggests more of them may be eligible for Medicaid services over time. Although the poverty rate for New Hampshire’s residents aged 65 and older is lower than the overall poverty rate, data collected by the Census Bureau from 2013 to 2017 showed for every one resident aged 65 or older in poverty, there were about 2.5 residents in that age group who had income levels within 150 percent of the poverty level, including those who were in poverty (below 100 percent of the poverty level). In 2017, the annual income at the poverty threshold for a single householder aged 65 and older was $11,756, while for a household with two residents of this age was $14,816.[xvii] These figures suggest a higher concentration of near-poor older residents as a portion of the overall older population than in the population as a whole, in which there were only about 1.7 residents with less than 150 percent of poverty-level income for every one in poverty from 2013 to 2017 (see Figure 7).
Residents with limited means may be more reliant on those services paid with Medicaid reimbursement rates than the population as a whole, suggesting the workforce challenges among home health and personal care aides may limit the ability of an increasing number of older residents to receive Medicaid services at home.
Low Number of Available Workers Reportedly Limits CFI Medicaid Waiver Services
In New Hampshire, there are seven designated CFI case management agencies responsible for coordinating delivery of care. To understand the challenges currently facing CFI Medicaid Waiver service delivery due to workforce-related issues, NHFPI conducted a survey of these seven agencies. All seven responded to the survey. Questions were provided in an identical survey for all respondents, but the questions also offered the opportunity to provide comments.[xviii]
Survey respondents indicated that individuals may not receive CFI Medicaid Waiver services for which they are eligible for a variety of reasons at the individual level. Case management agencies reported that individuals may refuse budgeted services (6 of 7 indicated this has occurred in their experience), enter nursing facilities to receive services (4 of 7), or have services delivered by family members (4 of 7). Other reasons at the individual level were also provided.
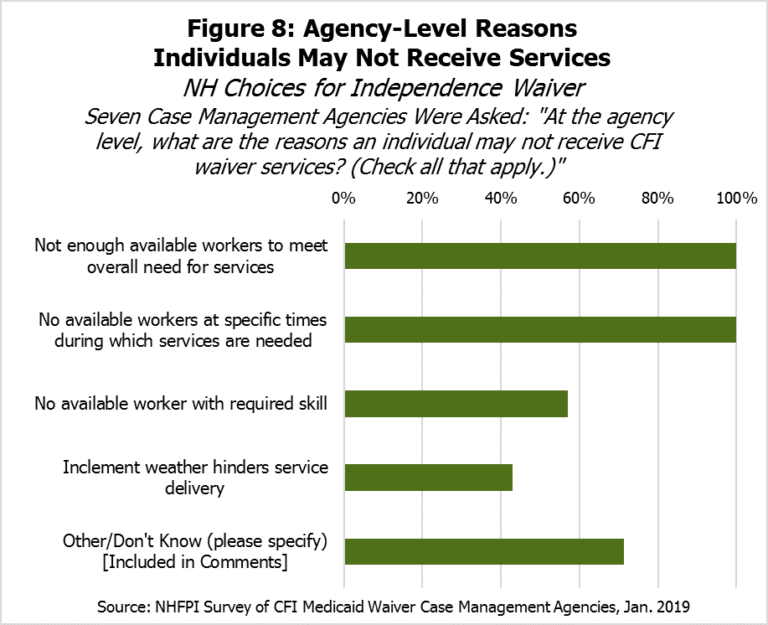
However, all seven agencies indicated an individual may not receive CFI Medicaid Waiver services because there are not enough available workers to meet the overall need for services or available workers at the times when services are needed (see Figure 8). Several agencies also identified that there may not be enough available workers with the required skill (4 of 7), and inclement weather may also hinder service delivery (3 of 7). Agencies’ comments noted that many areas of the state also lack providers available to deliver services, and that staff shortages have led to unfilled services. Five agencies noted that pay for staffing or Medicaid reimbursement rates should be increased, while a sixth noted providers are unable to hire or retain workers.
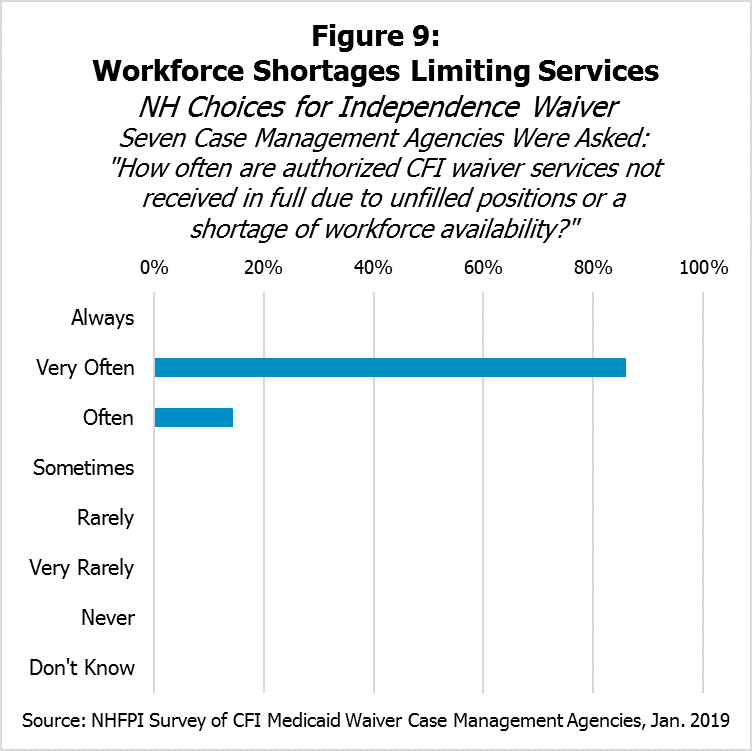
Of the seven case management agencies, six indicated that authorized CFI Medicaid Waiver services are not received in full due to unfilled positions or a shortage of workforce availability “Very Often,” with the seventh indicating the frequency was “Often” (Figure 9).
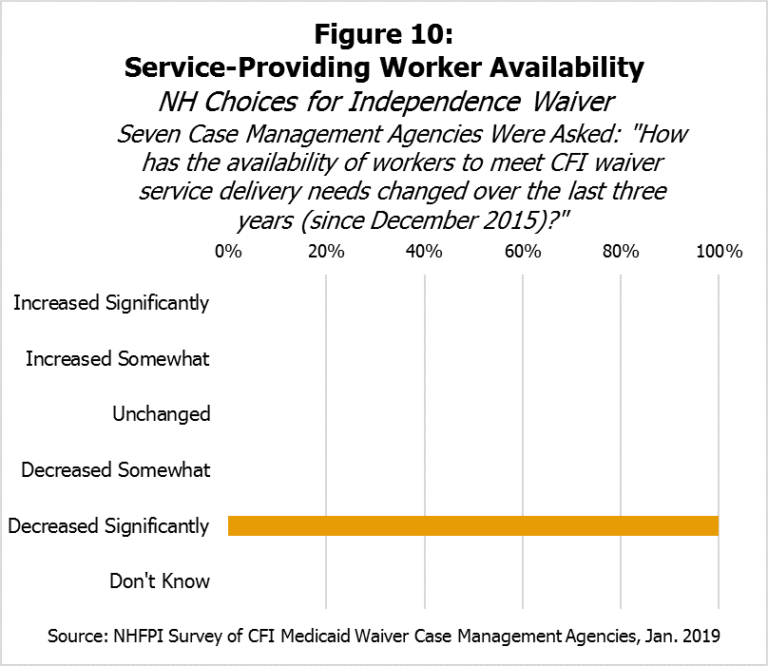
The seven case management agencies were also asked to characterize how the availability of workers to meet CFI Medicaid Waiver service delivery needs has changed since December 2015, when New Hampshire’s estimated unemployment rate dropped below 3.0 percent. When given five options ranging from “Increased Significantly” to “Decreased Significantly” for their responses, all seven agencies indicated the availability of workers had “Decreased Significantly” (see Figure 10). Respondent notes indicated that often CFI Medicaid Waiver services could offer few, if any, choices when only one provider is available. They also indicated that the pay structure has led to declines in both the quantity and quality of certain services, and those in need of the most support were not receiving services in some instances. Finally, respondents indicated some home health agencies no longer accept CFI Medicaid Waiver participants and that competitive wages are lacking.
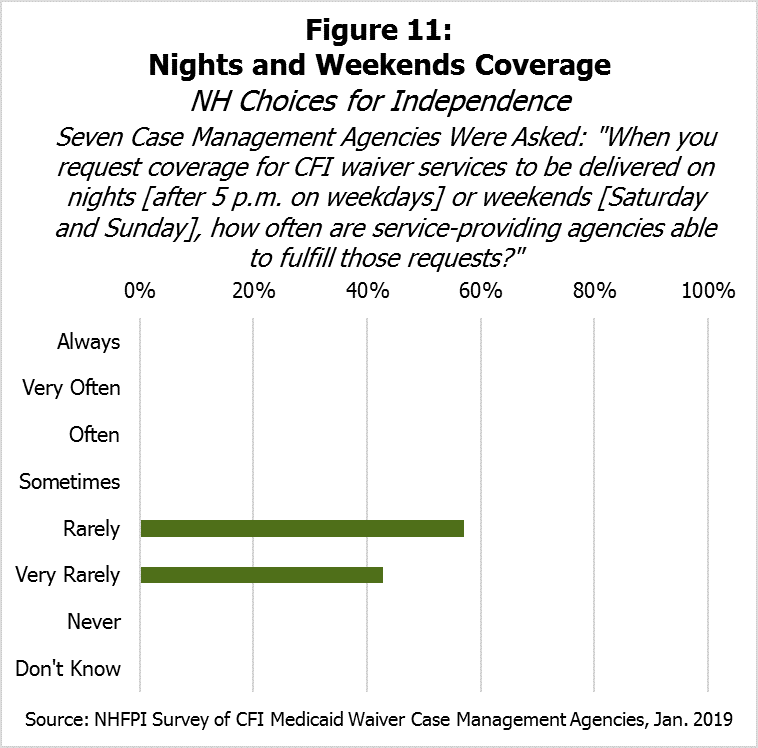
Survey respondents suggested that delivering services on nights (after 5 p.m. on weekdays) and weekends (Saturdays and Sundays) could be particularly challenging. Although respondents varied somewhat in the frequency of requesting night and weekend services, they responded similarly when asked how often service-providing agencies were able to fulfill those requests; four indicated “Rarely” and three indicated “Very Rarely” (see Figure 11). Six agencies indicated it is harder to meet service coverage needs on nights and weekends than it was three years ago, while one indicated it was about the same difficulty.
Case management agencies split on the provision of services where Medicaid reimbursement rates do not cover the costs. Three indicated they provided services in instances where Medicaid does not cover the costs, while three reported they did not. Three agencies indicated they no longer offer services for which they used to seek authorization because reimbursement rates do not cover the cost of these services, while three indicated they have not dropped any services due to reimbursement rates not covering costs. Some case management agencies have changed the frequency with which they request services in the last three years, with respite care identified as the most commonly changed (5 of 7). One respondent noted that few facilities continue to provide respite care, and another noted there are very few respite care providers in the state due to low reimbursement rates.
Case management agencies were also asked whether they serve homeless individuals with CFI Medicaid Waiver services and to describe their situations generally. Five of seven indicated they served homeless individuals, including individuals living in shelters, hotel accommodations or temporary housing, cars, or in the woods.
Unfilled CFI Medicaid Waiver Services
Workforce shortages and other factors contribute to authorized services not being provided. Services are requested by agencies for CFI-eligible individuals in need of services, and those services are authorized through Medicaid if approved. However, not all of those authorized services are fulfilled, meaning they were not delivered or paid for by Medicaid. Data provided by the New Hampshire Department of Health and Human Services in October 2018 show the dollar value of services authorized and those services that were paid (see Figure 12).
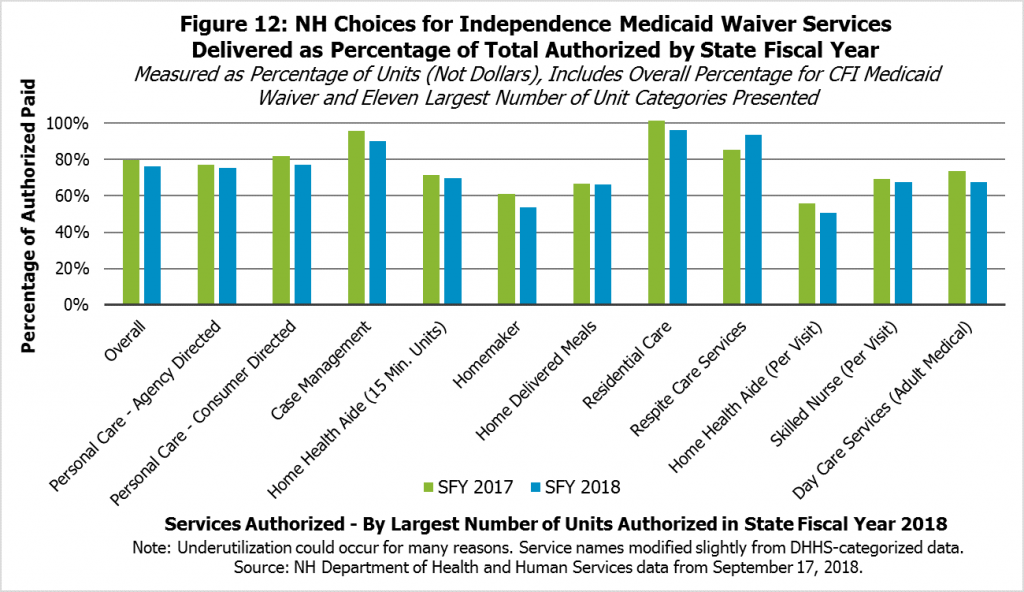
In aggregate, the percentage of CFI Medicaid Waiver services authorized that were paid for and had dates of service in State Fiscal Year 2017, which began July 1, 2016, was about 79.7 percent. Certain services that were authorized relatively frequently had somewhat lower rates of actual payment after authorization, such as homemaker services (61.2 percent), home health aide time-based care (71.5 percent) or per-visit (56.0 percent) services, skilled nurse per visit services (69.5 percent), and home delivered meals (66.7 percent). Other services, such as various residential care services, kinship care services, and certain supported housing services had utilization rates close to 100 percent of services authorized.
The overall percentage of services authorized that were delivered and paid for in State Fiscal Year 2018 was similar, at 76.3 percent. Some of the more commonly authorized units of services had similar or lower rates of actual payment than in the previous year, such as homemaker services (53.6 percent), home health aide time-based (69.9 percent) or per-visit unit (50.7 percent) services, skilled nurse per visit services (67.5 percent), and home delivered meals (66.4 percent).
Services that had near to 100 percent utilization rates in State Fiscal Year 2017 generally had high rates in the following year as well.
Not all these lower utilization rates are due to workforce shortages. NHFPI’s survey of CFI case management agencies and review of Department of Health and Human Services documentation indicate that services that were authorized may not be delivered due to refusal of services by the individual, such as if an individual may have their service needs fulfilled through some other mechanism or otherwise no longer requires the services. Providers may also have up to one year to submit invoicing for payment. The Department does not comprehensively track the reasons why authorized services were not accessed.[xix] However, given other information available, workforce shortages appear to be a major contributing factor.

While none of these indexes perfectly reflect the changes in costs for CFI Medicaid Waiver services, they do likely reflect different considerations related to reimbursement rates. The cost of providing home health services for Medicaid patients may best reflect the actual cost of supplying CFI Medicaid Waiver services of these three indexes, but it is a relatively narrow index that may be disproportionately affected by national trends, policy choices, or small sample sizes, and not all CFI Medicaid Waiver services may fall under this index. Nursing care facility costs likely reflect those that are an alternative to CFI Medicaid Waiver care in the community, but may also interact with the costs of CFI Medicaid Waiver services in some ways, depending on the particular services provided. The Consumer Price Index for consumers in the Northeast reflects the price trends in the broader economy, which best reflects the rate of growth in costs employees paid primarily through Medicaid reimbursements may face
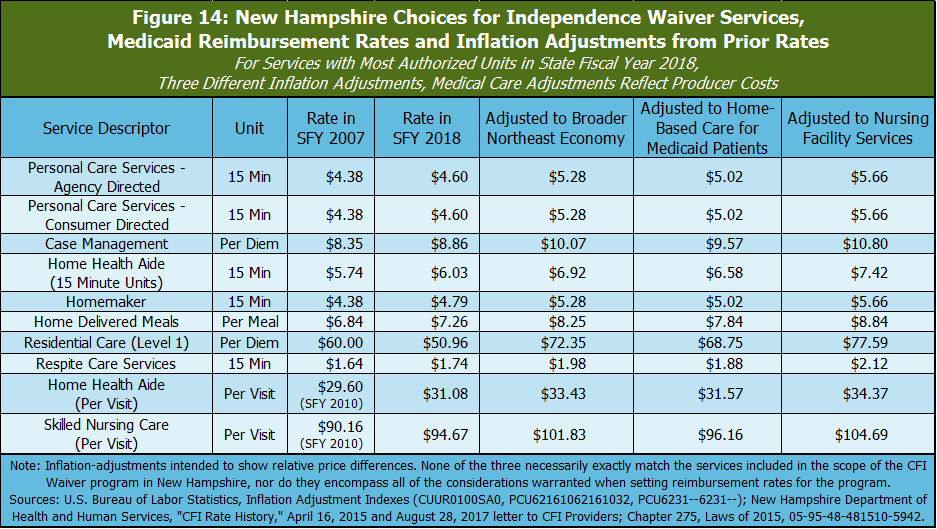
Key Medicaid reimbursement rates have not increased at the same pace as relevant measures of inflation. Adjusting for inflation using any of these three indexes, Medicaid reimbursement rates in State Fiscal Year 2018 were lower than they were in State Fiscal Year 2007, or in at least two instances State Fiscal Year 2010, for the most common CFI Medicaid Waiver services. The rate increases since State Fiscal Year 2007 have not matched the growth in real costs, according to these inflation adjustments. Although the State Fiscal Year 2007 figures are not necessarily any more or less reflective of the true cost of providing these services than reimbursement rates in any other year, the erosion of real purchasing power suggests that agencies providing these Medicaid services have less ability to offer competitive wages than they had in previous years.
Conclusion
Home- and community-based services help individuals stay where they want to live while receiving the care they need. CFI Medicaid Waiver services provide care to individuals who prefer to stay in their homes or communities but might, without the CFI Medicaid Waiver services available, otherwise require the level of care only provided in nursing homes. These services are paid for with a combination of federal, state, and county dollars, and seek to enable adults with a chronic illness or disability to stay in their homes or communities. Demand for these services will likely increase as New Hampshire’s population ages. Community-based Medicaid services are often less expensive than services at a full residential nursing home.
However, New Hampshire’s limited workforce availability in the short-term, and implications of demographic trends in the long-term, suggest that competitive pay is a major issue facing CFI Medicaid Waiver service delivery. Providers cannot effectively care for individuals if they do not have enough workers to do so, which can leave those in need without services. Those eligible for Medicaid are among the most in need in New Hampshire, and the ability for providers to supply those vital services is reportedly limited by workforce shortages. Wages at the lower end of this sector’s pay scale in New Hampshire also appear to be less competitive over time with other industries, including those offering low wages, and with the same industry in other states.
Medicaid reimbursement rates for key services have not kept up with inflation, and higher reimbursement rates may help mitigate the workforce shortage and help ensure Granite Staters with a chronic illness or disability get the care they need. Increasing reimbursement rates for CFI Medicaid Waiver services would be an important step to help ease workforce pressure and help ensure that the state can meet the home- and community-based care needs of a greater number of residents.
This study was supported by a grant from the Endowment for Health.
Endnotes
[i] For more on Medicaid in New Hampshire, see NHFPI’s Issue Brief Medicaid Expansion in New Hampshire and the State Senate’s Proposed Changes, March 30, 2018.
[ii] To read more about Medicaid costs and Medicaid reimbursement rates relative to Medicare and private insurance, see Lisa Clemans-Cope, John Holahan, and Rachel Garfield, Medicaid Spending Growth Compared to Other Payers: A Look at the Evidence, Henry J. Kaiser Family Foundation, April 13, 2016. See also Robin Rudowitz, Rachel Garfield, and Elizabeth Hinton, 10 Things to Know about Medicaid: Setting the Facts Straight, Henry J. Kaiser Family Foundation, March 6, 2019.
[iii] For more information, see the State of New Hampshire, Department of Health and Human Services, Division of Community Based Care Services, Bureau of Elderly and Adult Services, Choices for Independence Program Overview, August 6, 2014.
[iv] See RSA 166:8 and RSA 167:18-a, as well as the Choices for Independence Program Overview referenced above.
[v] For more information, see the AARP Public Policy Institute, Across the States: Profiles of Long-Term Services and Supports, August 2018.
[vi] For additional background on the New Hampshire economy, see NHFPI’s June 2018 Issue Brief New Hampshire’s Economy: Strengths and Constraints and NHFPI’s November 2018 presentation New Hampshire’s Vulnerable Families in the Post-Recession Economy.
[vii] The full list is available at The U.S. Bureau of Labor Statistics, Local Area Unemployment Statistics, Unemployment Rates for States, Seasonally Adjusted, with presented figures representing the preliminary figures for January 2019.
[viii] See Slide 9 of the Federal Reserve Bank of Boston New England Public Policy Center’s presentation from Dr. Bo Zhao, Economic Update: Nation, New England, New Hampshire, January 11, 2019.
[ix] For historical records for state unemployment rates, see The U.S. Bureau of Labor Statistics, Local Area Unemployment Statistics, Current Unemployment Rates for States and Historical Highs/Lows, Seasonally Adjusted, accessed when the most recent state-level rates were preliminary December 2018 rates. New Hampshire’s historical low unemployment rate was 2.2 percent, recorded in March 1988. The data series began in January 1976. Estimates are subject to periodic revision.
[x] For more discussion of this relationship and low unemployment nationally, see the Sylvian Leduc, Chitra Marti, and Daniel J. Wilson, Economic Letter: Does Ultra-Low Unemployment Spur Rapid Wage Growth?, The Federal Reserve Bank of San Francisco, January 14, 2019.
[xi] See Josh Bivens and Ben Zipper, The Importance of Locking in Full Employment for the Long Haul, The Economic Policy Institute, August 21, 2018 and Jared Bernstein, The Importance of Strong Labor Demand, The Hamilton Project (The Brookings Institution), February 27, 2018.
[xii] These two occupations were highlighted by the AARP Public Policy Institute in the 2018 analysis Across the States: Profiles of Long-Term Services and Supports. The U.S. Bureau of Labor Statistics describes the Home Health Aides occupation with: “Provide routine individualized healthcare such as changing bandages and dressing wounds, and applying topical medications to the elderly, convalescents, or persons with disabilities at the patient’s home or in a care facility. Monitor or report changes in health status. May also provide personal care such as bathing, dressing, and grooming of patient.” The Personal Care Aides occupation is described with: “Assist the elderly, convalescents, or persons with disabilities with daily living activities at the person’s home or in a care facility. Duties performed at a place of residence may include keeping house (making beds, doing laundry, washing dishes) and preparing meals. May provide assistance at non-residential care facilities. May advise families, the elderly, convalescents, and persons with disabilities regarding such things as nutrition, cleanliness, and household activities.”
[xiii] Available data are based on employer surveys, which are aggregated over several years and include potential error introduced from statistical sampling; as such, these wage levels are estimates often resulting from certain amounts of imputation, rather than the definitive result of a census, and relative comparisons are likely more valuable than specific dollar amounts. However, these are the best publicly-available data for these purposes. For more on these data, see The U.S. Bureau of Labor Statistics, Occupational Employment Statistics, Overview. All data presented are from the release in May of the calendar year represented.
[xiv] See Robin Rudowitz, Rachel Garfield, and Elizabeth Hinton, 10 Things to Know about Medicaid: Setting the Facts Straight, Henry J. Kaiser Family Foundation, March 6, 2019 and Lisa Clemans-Cope, John Holahan, and Rachel Garfield, Medicaid Spending Growth Compared to Other Payers: A Look at the Evidence, Henry J. Kaiser Family Foundation, April 13, 2016.
[xv] For a full table showing a history of minimum wage law changes in states, see The U.S. Department of Labor, Wage and Hour Division, Changes in Basic Minimum Wages in Non-Farm Employment Under State Law: Selected Years 1968 to 2018.
[xvi] The Office of Energy and Planning was renamed the Office of Strategic Initiatives in 2017. The data detailing these projections for all age groups are available on the Office of Strategic Initiatives website, published as State of New Hampshire, State and County Population Projections, September 2016.
[xvii] See the U.S. Census Bureau, Poverty Thresholds, using the 2017 tables.
[xviii] All information in this section collected by NHFPI through an online survey of the seven case management agencies for the New Hampshire Choices for Independence Medicaid Waiver in New Hampshire. See a complete list of the case management agencies on the Choices for Independence (CFI) Case Management Information Sheet from the Department of Health and Human Services, Bureau of Elderly and Adult Services, updated June 20, 2018.
[xix] The Department of Health and Human Services provided these data to New Hampshire Legal Assistance in an October 11, 2018 email, and provided similar information to the Granite State Home Health Association, Granite State Independent Living, and Ascentria In-Home Care in an August 15, 2018 letter. Both documents noted that workforce constraints, as well as the other factors noted in this paragraph, may be contributors to services being authorized but not paid.
[xx] For more on each of these indexes, see the U.S. Bureau of Labor Statistics, Consumer Price Index, Northeast Region – January 2019, PPI industry data for “Home health care services-Medicaid patients,” not seasonally adjusted, and PPI industry group data for “Nursing care facilities,” not seasonally adjusted.