Federal lawmakers will face several key fiscal policy deadlines in 2025. These deadlines include, but are not limited to, the federal government’s debt limit taking effect in January 2025; the end of the current spending caps on the federal government’s annual budget in September 2025; the sunsetting of enhanced health care marketplace subsidies, which provided an estimated $38.4 million to Granite Staters in 2023 to help them afford individual health coverage, at the end of 2025; and the expiration of key components of the 2017 Tax Cuts and Jobs Act (TCJA) after December 2025.
The TCJA made several permanent changes to the tax code, such as reducing the top corporate tax rate from 35 percent to a flat 21 percent rate. Many of the individual income tax provisions and certain provisions related to business income, however, will expire at the end of 2025. These provisions, if extended by Congress, would likely reduce the average federal income taxes paid by Granite Staters of all incomes. The provisions, if extended as currently implemented, would disproportionately benefit New Hampshire residents with the highest incomes while providing relatively limited benefits to the bottom 40 percent of households. Since the TCJA was enacted, the portion of all income accruing to the top one percent of tax filers reported on federal tax returns by New Hampshire residents increased from about one in every six dollars to one in every four.
Key Expiring Provisions
The TCJA, when passed in 2017, included a 2025 end date for several key policies to reduce the projected ten-year cost of the entire piece of legislation. Different sets of assumptions led to an array of cost estimates from federal agencies for the legislation as written, ranging generally from $1 trillion to $2 trillion in forgone revenue during the ten-year window.
The individual income and business tax provisions with early expiration dates substantially reduced the cost of the legislation, keeping cost estimates in that $1-2 trillion range rather than reducing public revenue by larger amounts. Policymakers will face the decision of whether to renew, extend, or make permanent these provisions after 2025. Major expiring provisions include:
- substantial changes to both tax brackets and tax rates, reducing rates at almost all levels of income, including the top tax rate, while holding the lowest tax bracket rate at the same level
- significantly expanding the standard deduction, while repealing the personal exemption, and doubling the maximum per child amount in the Child Tax Credit to $2,000
- a $10,000 annual cap on the federal tax deduction for state and local taxes paid, which limits a deduction that lowers federal tax liability based on the amount paid to state and local taxation
- reducing the amount of deductible interest on mortgages for homes to interest paid on a maximum of $750,000 in debt, lower than the pre-TCJA law that allowed deductions for interest paid on the first $1,000,000 in debt
- an increase in the exemptions for the Alternative Minimum Tax, which is designed to help ensure households with high incomes pay a minimum level of tax
- a doubling of the exemptions for the Estate Tax on wealthy households postmortem, to $13.6 million in 2024 after inflation adjustments, and the Gift Tax on transfers of money or property with no or below-market value exchanged in return
- a deduction on individual income taxes for up to 20 percent of qualifying business income for “pass-through” businesses for which business income appears on individual income tax returns
In May 2024, the U.S. Congressional Budget Office (CBO) estimated that extending the expiring provisions of the TCJA through 2034 would cost about $4.0 trillion, not including approximately $600 billion in additional costs due to increased payments of interest on federal debt, between 2025 and 2034.
Higher Income Households Receive Largest Benefits from Extensions
Modeling based on tax return data suggests higher-income households would be most likely to benefit from extending these provisions of the TCJA. Analysis conducted and published by the Institute on Taxation and Economic Policy (ITEP) suggests that the highest income taxpayers disproportionately benefit from the increased exemptions for the Estate Tax and the deduction for qualifying pass-through business income.
The cap on deductions for state and local taxes paid, however, effectively increased taxes for higher-income households nationwide, particularly for states with taxes on income and capital gains; estimates for Tax Year 2022 suggested only about six percent of New Hampshire taxpayers would benefit from a full repeal on the TCJA’s cap on state and local tax deductions.
While an extension of the TCJA would keep the cap on deductions, the benefits of the other provisions for higher income households would reduce federal revenues by $288.5 billion in 2026 alone, according to ITEP estimates from 2023. ITEP also estimated that, of those $288.5 billion in reduced taxes, about one percent of the benefits would flow to U.S. residents in the lowest 20 percent of the income scale, while the highest-income 20 percent would receive 63 percent of the benefits; the top five percent of income-earning households would receive nearly 40 percent of the total dollars not collected in taxes.
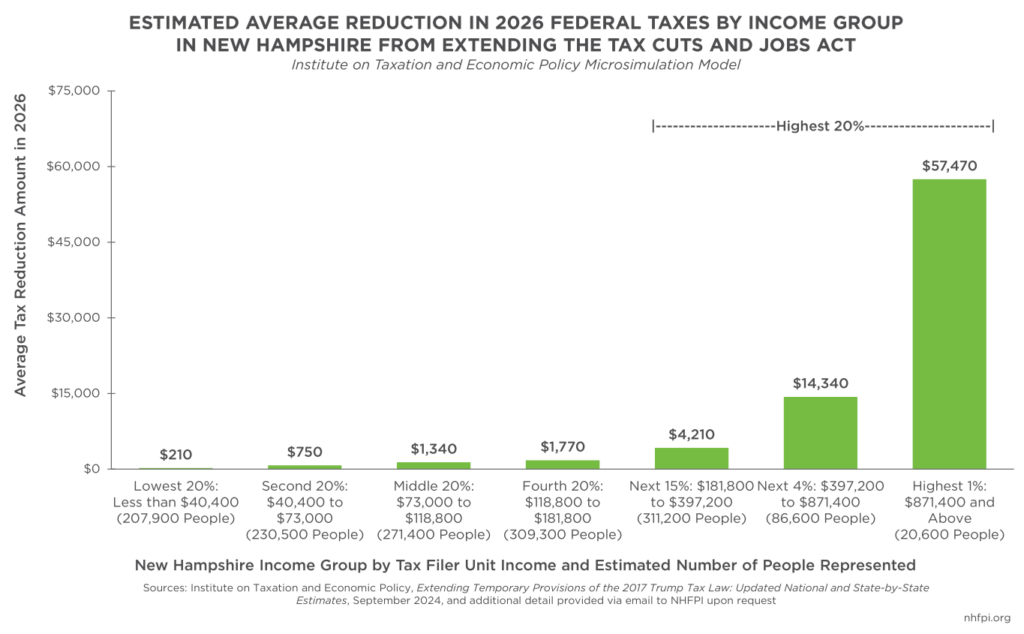
Among New Hampshire residents, recently updated modeling from ITEP indicated the average tax reduction varied considerably by income group. The 20 percent of Granite Staters with the lowest incomes, less than $40,400, would receive an average benefit of $210 in 2026. In the middle of the income spectrum, Granite Staters with incomes between $73,000 and $118,800 in 2026 would see an average tax reduction of $1,340. Taxpayers with $181,800 to $397,200, who are projected to be within the 80th to 95th percentiles of incomes within the state in 2026, would have an average tax reduction of $4,210. For taxpayers with incomes of $871,400 and higher, who are estimated to be in the top one percent of New Hampshire residents by income in 2026, the average tax reduction would be $57,470.
For context, the median income was about $53,800 among the approximately 157,000 households that rented their homes in New Hampshire during 2023. This modeling suggests that, if the TCJA was extended to 2026, the estimated tax reduction for the average taxpayer in the top one percent of the income scale would be approximately equivalent to the entire 2023 median income for a Granite State renter household.
Recent economic trends may have helped increase the value of the TCJA reductions for higher income households. An analysis from the CBO released this month indicated that the highest income households saw the most substantial increase in incomes across the 2019-2021 period. Income associated with capital gains and business income increased faster than labor income between 2020 and 2021. Capital income, capital gains, and business income were significant and increasing sources of income for the top one percent of households in 2021, according to the CBO.
Household Income Composition and Changes in New Hampshire
Data from the U.S. Internal Revenue Service (IRS) suggest New Hampshire residents with the highest incomes are more likely to rely on business income, capital gains, interest, and dividend income than taxpayers overall, including taxpayers with modest and middle incomes.
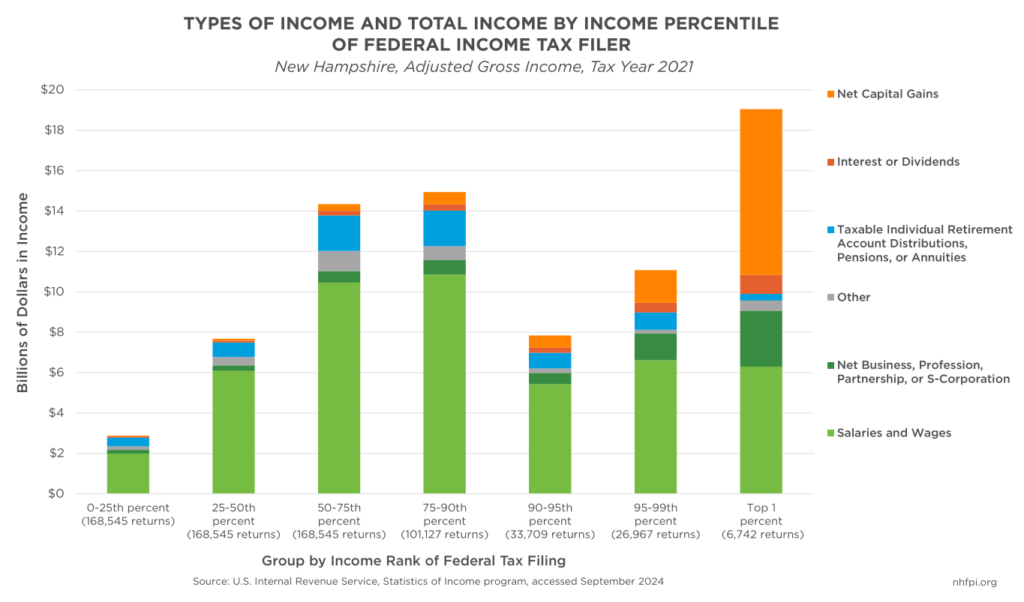
On the federal income tax returns filed for tax year 2021, the most recently available detailed data, total Adjusted Gross Income (AGI), or income after deductions, reported by New Hampshire federal tax filers was $77.8 billion spread across 674,178 tax returns form the state’s approximately 1.388 million residents that year. About 61.3 percent of all income reported was in salaries and wages. The next largest category, net capital gains, comprised 14.8 percent of all income reported. Taxable individual retirement account distributions, pensions, and annuities totaled 8.5 percent of all income collected, followed closely by net business, profession, partnership, or S-corporation income reported on individual tax returns in “pass-through” business income reported on individual tax returns, totaling 8.3 percent of all personal income. Interest and dividends paid comprised about 3.0 percent of all income reported.
However, the composition varies substantially across income groups, particularly at the top of the income scale. About $19.1 billion in AGI was reported by the 6,742 top one percent of tax filers, totaling about 24.5 percent, or nearly one quarter, of all income reported by Granite State taxpayers. Within incomes for the top one percent in New Hampshire in 2021, $8.2 billion (43.1 percent) was from capital gains, while net business, profession, partnership or S-corporation income was $2.8 billion (14.6 percent). The share of AGI from capital gains dropped consistently as income decreases across the computable income groups, and capital gains income only accounted for about 1.3 percent of reported AGI on average for earners below the median tax filing, or those in the bottom 50 percent of the income scale by tax filing. Net pass-through business-related income fell as well, dropping to about four percent for taxpayers in the 25th to 75th percentiles, or the middle of the income scale, before rising again to 6.6 percent for filings in the bottom quartile, which may reflect businesses that were starting, struggling, or side-business efforts that provided small amounts of supplementary income. These data indicate business-based income and capital gains income are disproportionately larger sources of revenue for Granite Staters with higher incomes.
While these 2021 data provide insights, both business pass-through income and capital gains income may be relatively volatile, particularly given capital gains income that may be generated from the sale of stocks; keeping income levels constant, using a different dataset, and looking across several years may provide greater certainty regarding the relative importance of business pass-through income and capital gains.
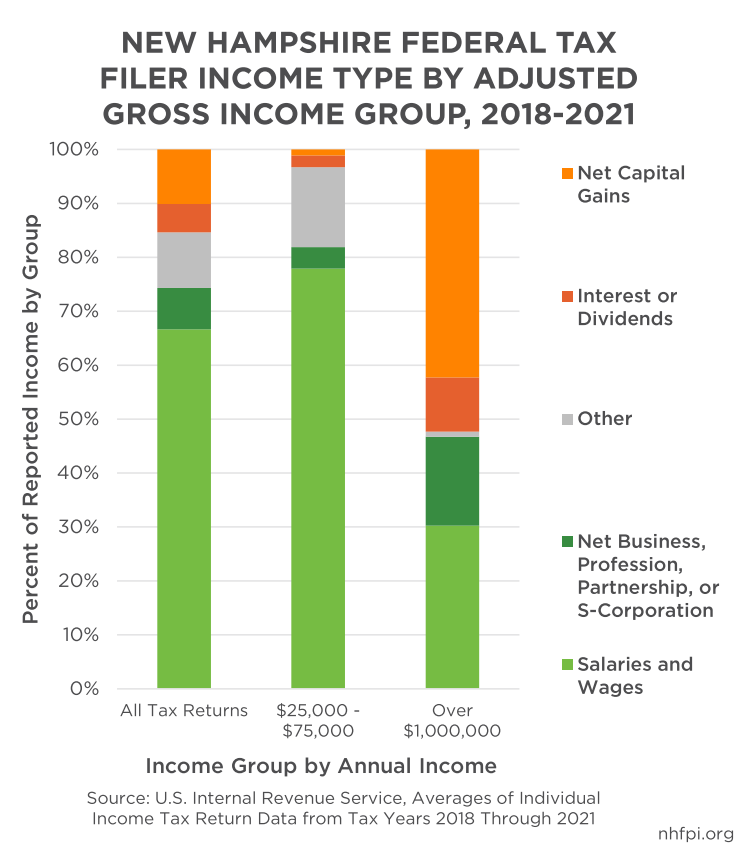
Aggregated IRS tax return data from 2018 to 2021, drawn from a differently-organized IRS dataset and representing all available complete years of data since the TCJA was signed into law, shows the composition tendencies from 2021 were not unique to that year. Salaries and wages accounted for 66.6 percent of total AGI reported by New Hampshire taxpayers across tax years 2018 to 2021. For taxpayers with AGI between $25,000 and $75,000 during these four years, salaries and wages were 77.9 percent of this reported income, and net business, profession, partnership or S-corporation income reported was 4.0 percent of AGI.
However, for New Hampshire filers reporting more than $1 million in AGI, salaries and wages were only 30.3 percent of AGI, while interest and dividends were 10.1 percent and net capital gains were 42.3 percent. Net business, profession, partnership or S-corporation income reported on individual tax returns was a combined total of 16.4 percent of income collected by these high-income filers. Tax filers with more than $1 million in AGI accounted for 68.2 percent of all reported business pass-through income of these types. These data reinforce that the deductions for qualifying pass-through business income in the TCJA would likely be disproportionately beneficial for higher-income households in New Hampshire.
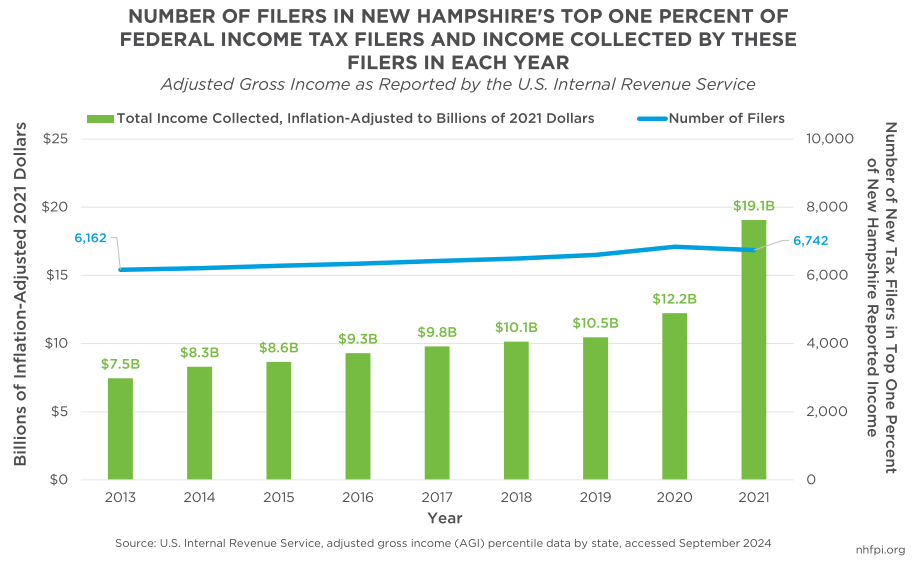
The top one percent of filers with the highest incomes in New Hampshire have remained a relatively consistently-sized group, although the income required to be within the group has increased substantially. Filers may represent either individuals or households, such as joint filers who may also have dependents. The most recently available data suggest the number of filers with the top one percent of reported incomes in New Hampshire grew from 6,162 filers in 2013 to 6,841 filers in 2020; the number of filers in the top one percent declined to 6,742 in 2021. The AGI required to be in the top one percent of filers, unadjusted for inflation, rose from $400,335 in 2013 to $719,760 in 2021.
Adjusting for inflation to constant 2021 dollars, the total amount of AGI going to the top one percent of filers in 2013 in New Hampshire was about $7.5 billion, and accounted for 14.6 percent of all AGI reported by New Hampshire tax filers that year. By 2018, the first year the TCJA was enacted, the total amount of dollars reported by the top one percent was about $10.1 billion, accounting for 16.4 percent of all income reported by Granite Staters; this change continued a pattern of year-over-year increases since the 2013 data. The percentage of all income accruing to the top one percent of filers increased in 2019, 2020, and 2021, with the most significant increase in 2021. That year, about $19.1 billion in AGI was reported by the 6,742 filers in the top one percent, totaling about 24.5 percent of all reported AGI in the state.
Incomes rose significantly for the highest income households in 2021 largely due to an increase in capital gains income, both nationally and in New Hampshire. IRS data show total AGI for the top one percent of filers grew about 39.2 percent nationwide, and increased 61.9 percent in New Hampshire, unadjusted for inflation. Among Granite Staters, total AGI for all tax filers grew substantially between 2020 and 2021, rising about 20.2 percent in total. Wage and salary income increased by 10.5 percent, while capital gains rose 94.1 percent, showing faster accrual of market value to capital, such as stock ownership, than labor during this period.
More high-income taxpayers reported earning over $1 million in 2021 than in prior years as well. The number of filers reporting more than $1 million in income rose by 51.3 percent between 2020 and 2021. Average income for this group rose 92.0 percent and comprised 61.6 percent of the total increase in reported AGI in New Hampshire between 2020 and 2021. Between 2020 and 2021, the average income for filers with more than $1 million in AGI rose about $885,910 (26.9 percent), unadjusted for inflation.
Expanding the analysis to New Hampshire filers who reported more than $500,000 in AGI and examining changes across the 2018 to 2021 time period provides additional insights. The total number of returns reporting at least $500,000 in AGI rose from 6,980 to 12,350 (76.9 percent) from 2018 to 2021, and the number of individuals reflected by those returns grew from 18,430 to 32,150 (74.4 percent). Total AGI for this group grew from about $9.7 billion in 2018 to approximately $22.4 billion in 2021, or 129.7 percent. After adjusting for inflation, the total AGI growth rate was still a robust 114.8 percent between 2018 and 2021, which outpaced the 74.4 percent growth of individuals in households with at least $500,000 in AGI during this period. Relative to TCJA provisions that may disproportionately send more resources to higher income households, the amount of qualified business income deduction reported in 2018 was $220.3 million among New Hampshire tax filers in 2018; that total grew to $397.9 million by 2021, up 80.6 percent since 2018.
Decisions in 2025
While data are limited and not yet available beyond 2021, the reported incomes of the highest-income households, both in New Hampshire and nationally, have grown more substantially than incomes for individuals and families with moderate and lower incomes. The average IRS-calculated federal income tax rate on the highest earning households in New Hampshire was reduced after the TCJA took effect, and has remained lower than it was in 2017, when the TCJA was signed into law, during each year since then with available data.
With many key individual income tax provisions of the TCJA expiring amidst several other significant fiscal decisions looming, federal policymakers will need to determine which actions to take regarding the future of the tax code.
– Phil Sletten, Research Director